
This code is written in MATLAB so it can’t be run in-browser, but above are links to download my MATLAB file, and the Excel file containing the data needed to run the script.
When run, this script reads through the Excel document for locational data on nearby stars, complete with right-ascension, declination and distance (in light-years). The stars are then plotted in the XY, XZ and YZ planes, with orientation referencing our home planet. Star information was taken from this Wikipedia page.
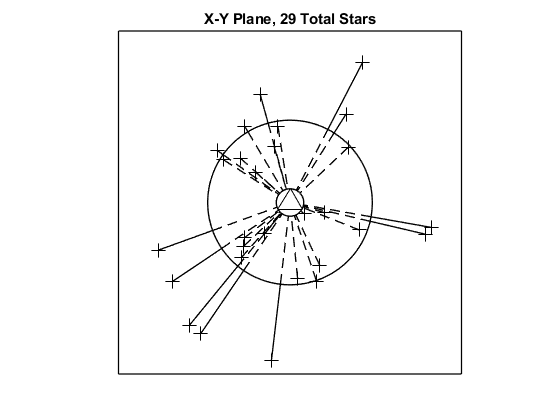
Figure 1: Example images generated from the code below.
The stars used to generate the figures are controlled by the following settings below:
- num_stars – maximum number of stars
- border_width – length of each side of the outer box
- size_sol – size of our star at the center of each image
- size_pt – size of every other star
- size_ln – thickness of the lines leading to each star
- size_border – thickness of the image border
- length_bound – maximum render distance for stars
- length_outer – length to the outer circle
- length_inner – length to the inner circle / minimum render distance for stars
The graphical features of the figures are controlled by the following settings below:
- style_sol – point shape for our star
- style_pt – point shape for every other srar
- style_outerln – line style for lines outside the outer circle
- style_innerln – line style for lines inside the outer circle
Raw MATLAB Code
% StarfieldMapper
% Here's just a simple little project I made on the road. It takes
% information about nearby stars and plots it in a 3 different 2D
% cross-sections. This goes in it's own separate folder because you
% need an Excel document ("Starfield.xlsx") to store data on the
% nearby stars.
%
% JRW, 7/25/2024

clear;
clc;
fprintf('Program start...');

% Data Settings
num_stars = 99;
border_width = 25;
size_sol = 250;
size_pt  = 100;
size_ln  = 1;
size_border = 1;
length_bound = 12;
length_outer = 6;
length_inner = 1;

% Figure Settings
style_sol = '^';
style_pt = '+';
style_outerln = '-';
style_innerln = '--';

% Loop through each perspective
for count = 1:3
    if count == 1
        coord1 = 1;
        coord1name = 'X';
        coord2 = 2;
        coord2name = 'Y';
    elseif count == 2
        coord1 = 1;
        coord1name = 'X';
        coord2 = 3;
        coord2name = 'Z';
    else
        coord1 = 2;
        coord1name = 'Y';
        coord2 = 3;
        coord2name = 'Z';
    end

    % Load data
    pos = readmatrix('Starfield.xlsx', 'Range', 'M:O');
    pos = pos(2:end,:);
    x = pos(:,coord1);
    y = pos(:,coord2);
    dist = sqrt( x.^2 + y.^2 );

    % Null the unused stars
    star_count = min(num_stars,size(pos,1));
    for i = 1:star_count
        if dist(i) < length_inner || dist(i) > length_bound
            dist(i) = NaN;
            x(i) = NaN;
            y(i) = NaN;
        end
    end

    % Adjust data
    x = rmmissing(x(1:star_count));
    y = rmmissing(y(1:star_count));
    dist = rmmissing(dist(1:star_count));

    % Generate figure
    figure(count);
    hold on;
    scatter(x, y, size_pt, style_pt, 'k');
    scatter(0, 0, size_sol, style_sol, 'k');
    title(sprintf('%c-%c Plane, %d Total Stars',coord1name,coord2name,length(x)+1));
    axis equal;
    axis off;
    circle(0,0,length_inner,size_ln);
    circle(0,0,length_outer,size_ln);
    for k = 1:length(x)
        x_inner_start = length_inner * x(k) / dist(k);
        y_inner_start = length_inner * y(k) / dist(k);

        if dist(k) > length_outer
            x_outer_start = length_outer * x(k) / dist(k);
            y_outer_start = length_outer * y(k) / dist(k);

            line([x_outer_start x(k)], [y_outer_start y(k)], 'linewidth', size_ln, 'color', 'k', 'linestyle', style_outerln);
            line([x_outer_start x_inner_start], [y_outer_start y_inner_start], 'linewidth', size_ln, 'color', 'k', 'linestyle', style_innerln);
        else
            line([x(k) x_inner_start], [y(k) y_inner_start], 'linewidth', size_ln, 'color', 'k', 'linestyle', style_innerln);
        end
    end
    hold off;

    % Draw lines
    pbaspect([1 1 1])
    line([-border_width/2 border_width/2], [border_width/2 border_width/2], 'linewidth', size_border, 'color', 'k', 'linestyle', '-');
    line([-border_width/2 border_width/2], [-border_width/2 -border_width/2], 'linewidth', size_border, 'color', 'k', 'linestyle', '-');
    line([border_width/2 border_width/2], [-border_width/2 border_width/2], 'linewidth', size_border, 'color', 'k', 'linestyle', '-');
    line([-border_width/2 -border_width/2], [-border_width/2 border_width/2], 'linewidth', size_border, 'color', 'k', 'linestyle', '-');

end

fprintf('\nProgram complete \n');

function circle(x,y,r,width)
%PLOT_CIRCLE draws a circle at a certain (x,y) position with a radius and
%line width.
th = 0:pi/50:2*pi;
xunit = r * cos(th) + x;
yunit = r * sin(th) + y;
plot(xunit,yunit,'k','linewidth',width);
end